The Cost of Getting Safety Wrong Is Measurable

Aug 27 / Eezylearn Team

Key Takeaways

  • Safety incidents create direct costs (medical care, repairs, legal fees) and indirect costs (downtime, retraining, delays) that often end up higher than the first estimate

  • Tracking leading indicators helps you spot risk early, before an incident happens and losses stack up

  • A simple cost model helps you explain safety spend in business terms, using a few inputs like hours of downtime, rework rate, and incident frequency

When one incident derails a quarter

Next, picture a minor hand injury that becomes a recordable incident. The direct costs may look contained, but the operational impact often spreads across 6–12 weeks: supervisor time, short-staffed shifts, retraining, and a backlog of corrective actions that keeps coming back in meetings.

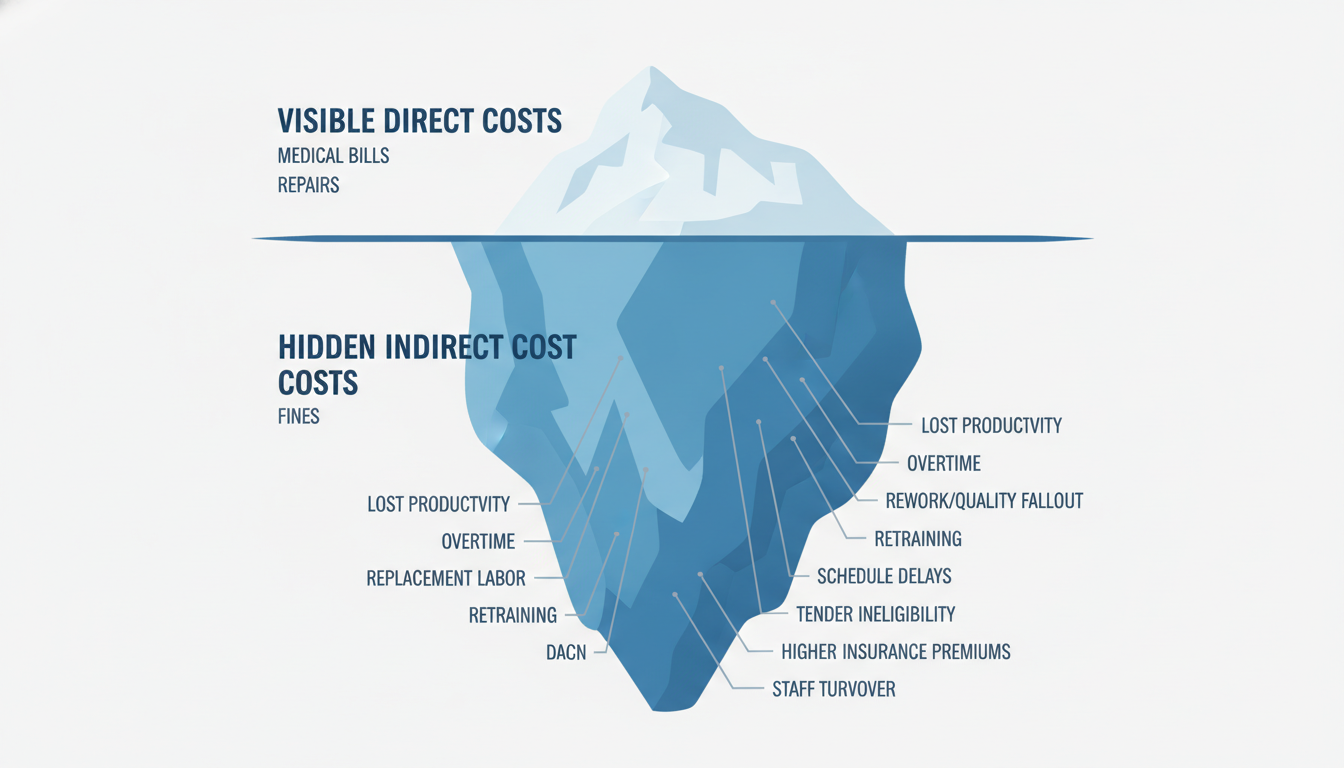
Even when insurance covers treatment, the hidden costs usually show up elsewhere. A common benchmark is that hidden costs can run 2–10× the direct, insured costs, especially when the incident triggers stop-work, rework, and extra oversight.

Here’s what tends to expand the impact from one event into a quarter-long distraction:

  • Incident response and reporting time for supervisors and HSE

  • Investigation interviews that pull 3–6 people off task for 30–90 minutes each

  • Temporary labour, overtime, or reduced output while a role is covered

  • Equipment downtime, cleanup, and restart checks that delay schedules

  • Client, auditor, or leadership updates that add pressure and extra reviews

  • Morale and trust hits, where teams slow down because they are unsure what is safe

If you do one thing, track time spent after the incident, not just medical or repair bills. Many teams can pull this together with a simple log for the first two weeks: who was involved, hours spent, and what work was delayed or repeated. That gives you a realistic picture of the business interruption cost.

What safety failures really cost the business

Next, it helps to separate what you can see on an invoice from what shows up later in your margins.

The direct costs are the obvious ones: first aid or medical treatment, equipment repair, cleanup, investigation time, and any regulatory action. These costs are painful, but they are usually the smallest slice because they are counted once and booked to one place.

The bigger hit often comes from productivity loss. A crew that normally installs 40 meters of cable tray per shift might drop to 25 for a week because access is restricted, tools are out of service, and people are pulled into statements and re-planning.

Also, the staffing knock-on effects add up fast, especially on tight schedules. Overtime to catch up can run for 2 to 4 weeks, and replacement labour often means higher hourly rates plus lower output while the new person learns the site.

Retraining and re-induction time is real work: a supervisor might spend 2 hours per new starter for refreshers, and a competent operator can still need several shifts to reach normal pace. If one incident triggers a temporary stand-down or a change in method, you can also lose planned maintenance windows and create bottlenecks that push other trades idle time.

Quality fallout is the hidden cost many teams miss. Rushed rework, missed checks, and damaged materials can lead to returns, warranty call-backs, and scrap, especially in manufacturing, warehousing pick-pack, and field service.

That said, the longest-lasting costs are the ones that affect revenue and your ability to win work.

Client confidence can drop after a single reportable event, even if no one is seriously hurt. Some clients tighten site access, add audit requirements, or move you from preferred to probationary status, which slows approvals and stretches cash flow.

Tender eligibility can change overnight if your incident rate or corrective action performance flags in pre-qualification. Insurance premiums can rise at renewal, and the internal admin load grows through extra documentation, audits, and claims management.

Staff turnover is another multiplier: when experienced people leave, you lose job knowledge and increase onboarding volume, which raises risk again. If you do one thing, map both the visible costs and the hidden costs after your next incident so leadership sees the full iceberg, not just the tip.


Check out this HSA article on costs in 2025! 

How to measure safety cost in your workplace

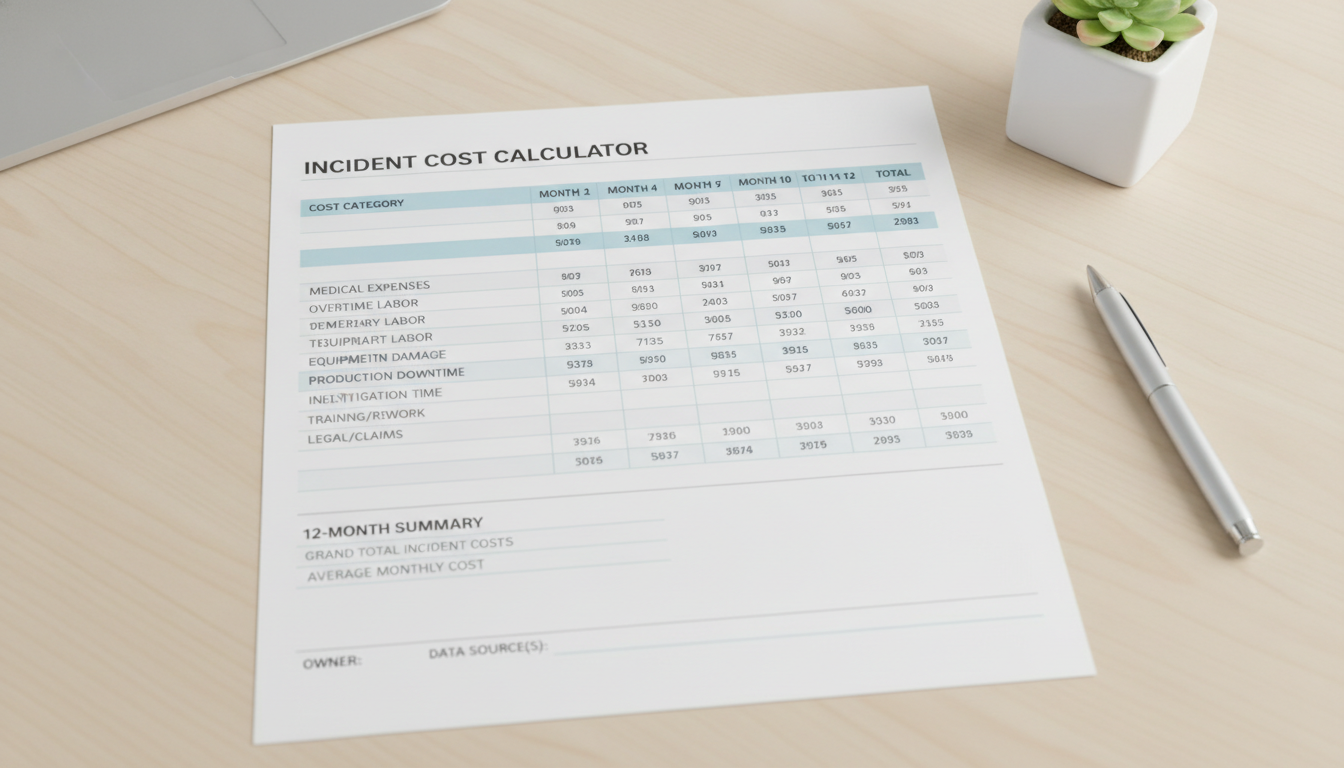
Next, you need a repeatable way to turn incidents into a cost number that leaders will accept. A simple incident cost worksheet built from the last 12 months of incidents and near-misses is usually enough to spot patterns and stop arguing about anecdotes.

If you do one thing, start with the events you already track: first aid, recordables, property damage, and near-misses. Near-misses matter because they often show the same cost drivers (downtime, rework, supervisor time) even when there is no medical bill.

Build your worksheet with 10–15 cost lines, and fill it per event. Keep definitions tight so two people would estimate it the same way:

  • Medical and first aid costs (invoice amount or claims paid)

  • Workers’ comp and claim handling time (claims adjuster notes, HR time)

  • Overtime and backfill labor (extra hours after the event)

  • Temporary labor or contractor support (hours and rate)

  • Equipment, tool, or product damage (repair or replacement)

  • Production downtime (minutes or hours stopped)

  • Scrap and rework (units scrapped, rework hours)

  • Supervisor and investigation time (hours from involved roles)

  • Training and re-onboarding time (hours to return to standard work)

  • Transportation and misc. (shipping, cleanup, disposal)

That said, the worksheet only stays credible if every line has an owner and a data source. Assign one person to each cost line and write down where the number comes from so it stays defensible and repeatable:

  • Safety: incident details, investigation hours, corrective action time (EHS log)

  • Operations: downtime minutes, schedule impact, overtime hours (shift reports)

  • Maintenance: repair parts and labor (work orders)

  • HR: lost time, restricted duty days (HRIS)

  • Finance: invoice totals, standard labor rates (ERP)

  • Claims or insurance: paid amounts, reserves where available (claims portal)

If you’re short on time, skip perfect costing and focus on consistency. Use the same labor rate assumptions each month, record downtime in 15-minute blocks, and add a notes column for what was estimated versus pulled from a system.

Here’s the catch: this works best when you review the worksheet monthly, while details are still fresh. It fails when you wait for year-end and try to reconstruct hours from memory, so build a 30-minute recurring review with Safety, Ops, and HR to lock the numbers in.

Managing health and safety effectively starts with understanding the risks. Risk assessments help identify what can cause harm and what controls are needed to eliminate or reduce that risk. Training then complements those controls by giving people the knowledge and competence to work safely within the systems you’ve put in place.

If you’re reviewing how your organisation manages health and safety, our online training courses can help support that process.

Check out our Courses

Preventing losses with leading indicators and smart controls

Next, shift your attention from lagging results (injuries, days lost, claims) to leading indicators you can act on before something goes wrong. A useful benchmark is simple: if you can review the number weekly and assign an owner within 24 to 48 hours, it is actionable enough to prevent losses.

Choose indicators that predict risk, not metrics that only describe activity. For example, a warehouse supervisor might track near misses from forklift routes, while a site manager tracks hazard reports tied to specific areas or tasks. Practical leading indicators to start with include:

  • Near misses reported per week (with a short note on task and location)

  • Hazard reports submitted and fixed (split by open vs closed)

  • Audits closed on time (percent closed within a set window, like 14 to 30 days)

  • Training completion for high-risk tasks (percent complete before assignment)

  • Fatigue metrics that fit your work (hours worked, consecutive shifts, or break compliance)

Here’s the catch: a higher count is not always bad. Near misses and hazard reports often rise when reporting becomes safer and faster, then fall later as controls start working. If you do one thing, do this: track both volume and closure speed, because “reported but not fixed” is where risk piles up.

So once you can see risk building, prioritize controls by risk and ROI, then confirm they work with follow-up checks. Start with the control types that remove exposure first, then move down the list:

  • Eliminate the hazard (stop the task, remove the chemical, redesign the workflow)

  • Engineer controls (guarding, interlocks, ventilation, physical barriers)

  • Administrative controls (permits, pre-start checklists, job rotation, supervision)

  • PPE (last layer: fit, use, and supply checks)

In practice, controls work best when they are matched to the top two or three high-risk scenarios, not spread thin across dozens of minor issues. A common mistake is choosing training or PPE because it is quick, then assuming the risk is handled; the fix is to schedule a follow-up check 7 to 14 days after rollout and verify one or two observable points, such as whether guards stay in place during busy shifts or whether audits are actually closed on time.

Closing remarks

So it helps to end with a simple reminder: “What gets measured gets managed.” When you track safety the same way you track quality, downtime, and budget, it stops being a vague priority and becomes a set of numbers you can improve.

That said, take one honest look at your workplace: where is safety currently treated as a cost, instead of a measurable source of avoided loss. Pick one area to change next, set one baseline (for example, near-miss reports per week or completion time for a critical inspection), and review it on a regular cadence such as every Friday for 10 minutes.